Contents:
- Threat Intelligence Graph
- Threat Groups Panel
- Software Panel
- Using Analytics for Reporting
- Drilling Down
- Cross-Campaign Trends
The Analytics tab in Campaign Results provides threat intelligence context for your testing, including attack techniques, threat groups, and software mapped to each payload.
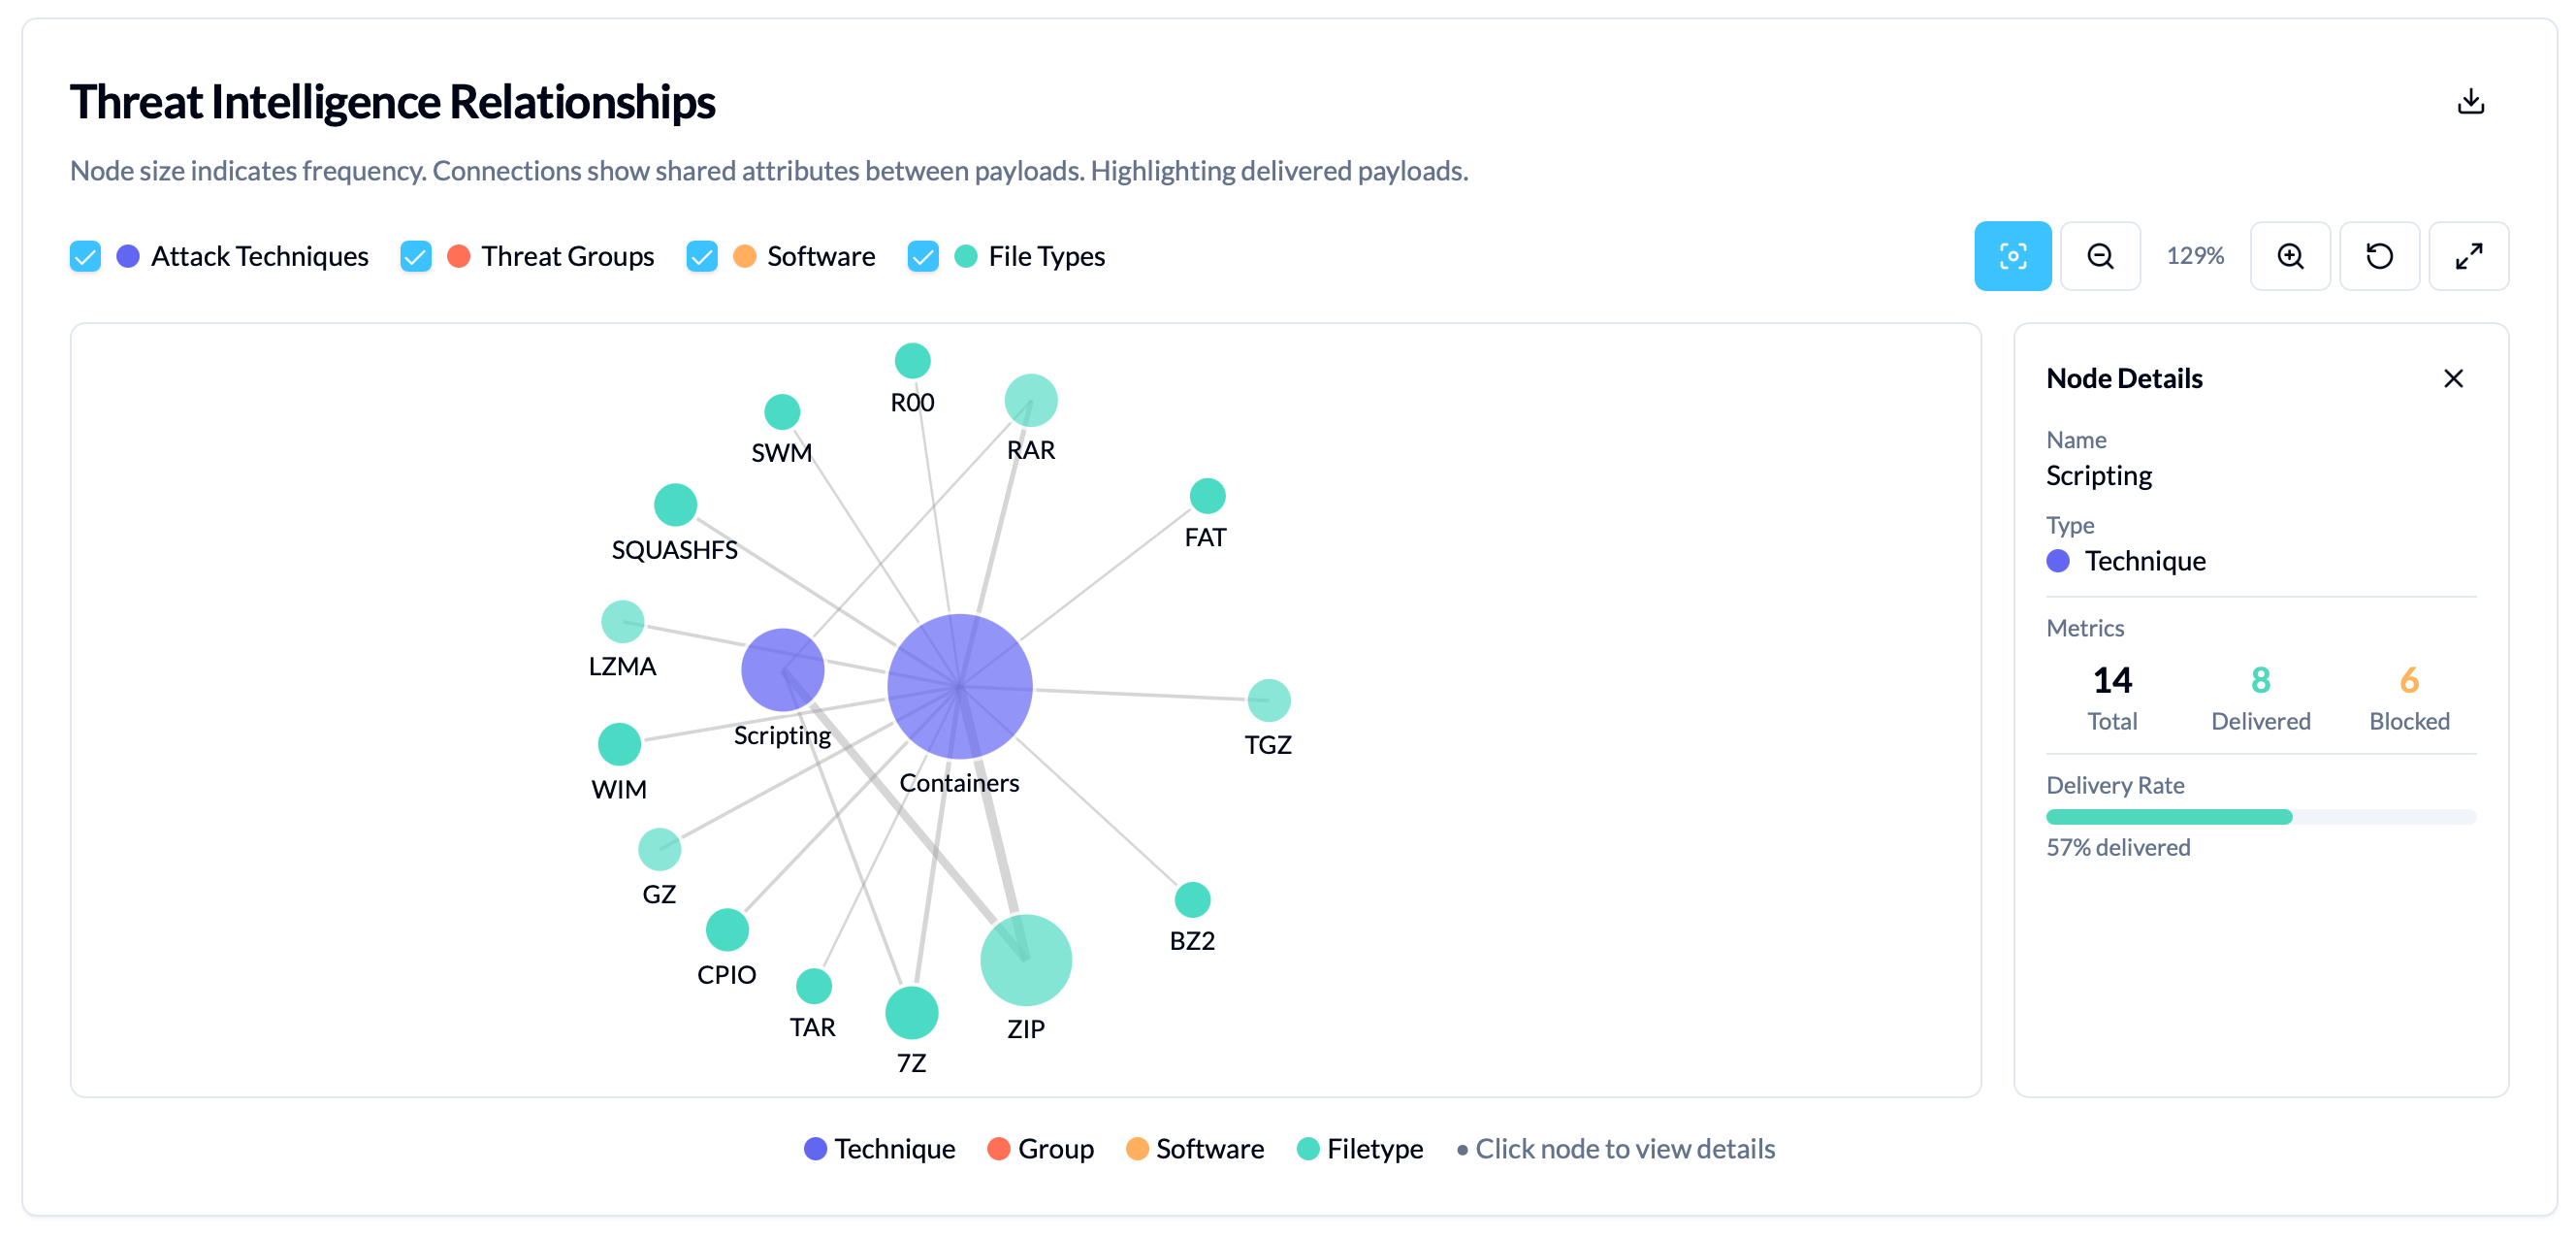
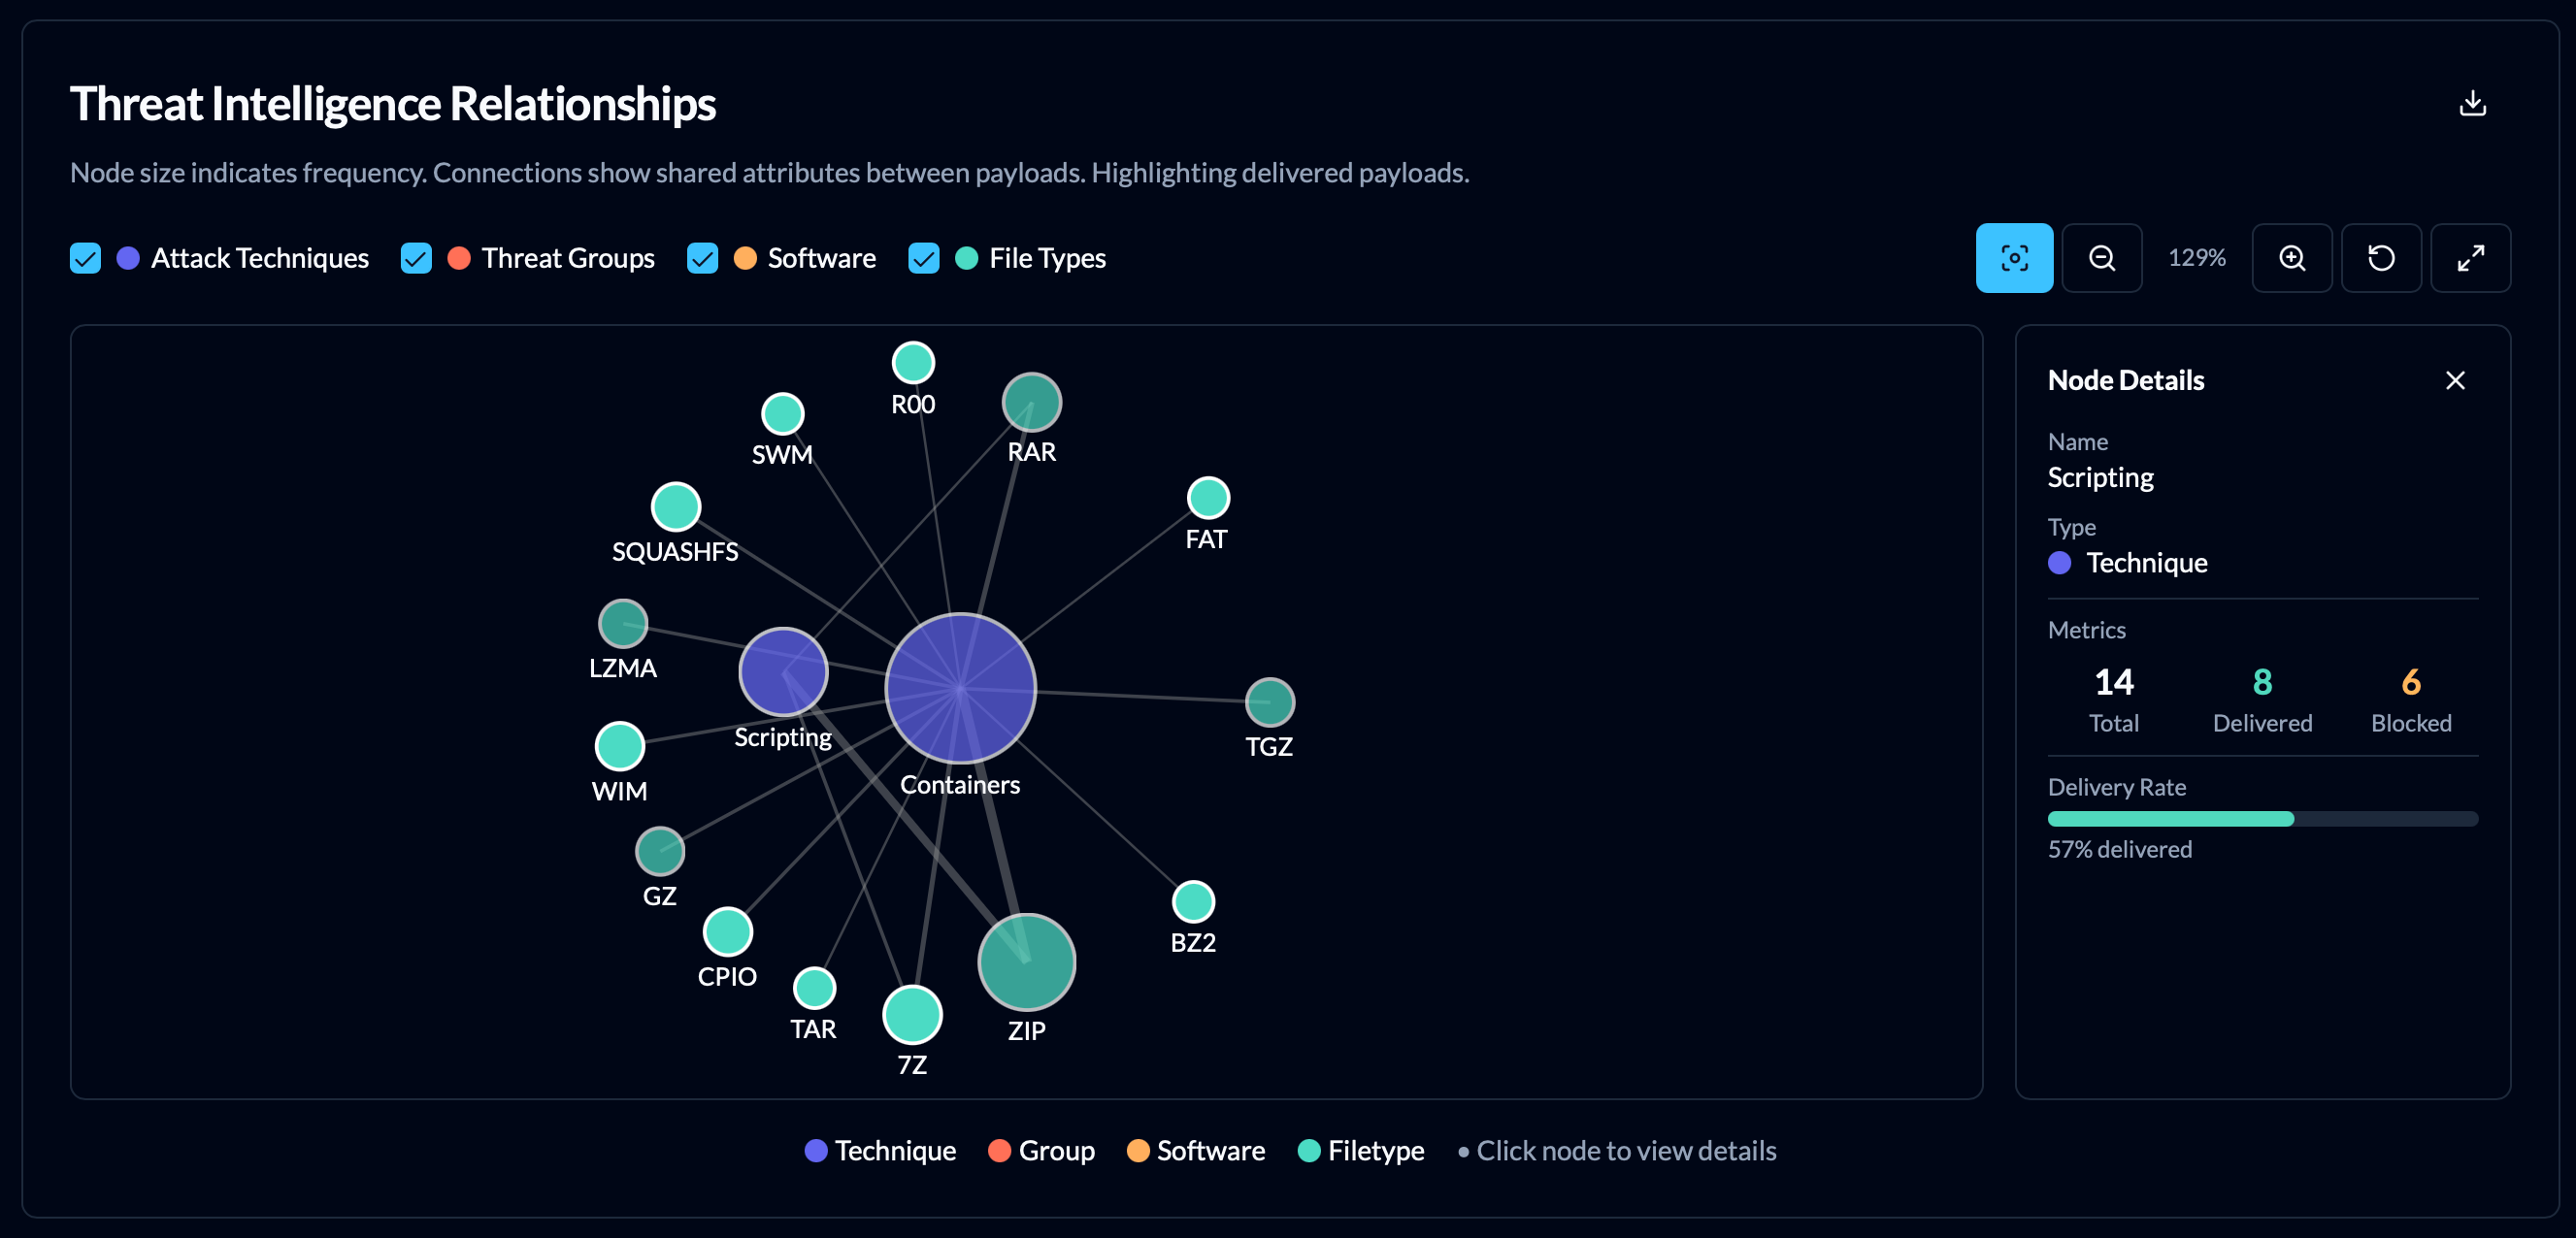
Threat Intelligence Graph
In the Analytics view, you’ll find the threat intelligence graph which combines the metadata for payloads to show relationships between attack techniques, threat groups, and software. This can help identify common themes to target for remediation and attack surface reduction.
Export Graphs and Campaign Data
All graphs in the analytics and campaign views are exportable as PNG image files.
In addition, campaign results can be exported in their raw format with the Export Results button as CSV or JSON.
A full report of the campaign, including its Insights and Recommendations, can also be generated with the Download Report button which produces Markdown, JSON or HTML.